 df733199b4
Per-model and weekly computed figures: how often each current 8TB+ drive
goes on sale (best price 5%+ below its own rolling-median baseline) and how
deep. NAS lines discount several times more often than enterprise; similar
depth. Computed values only, compiled from Amazon price history.
4.5 KiB
NAS drive price trends
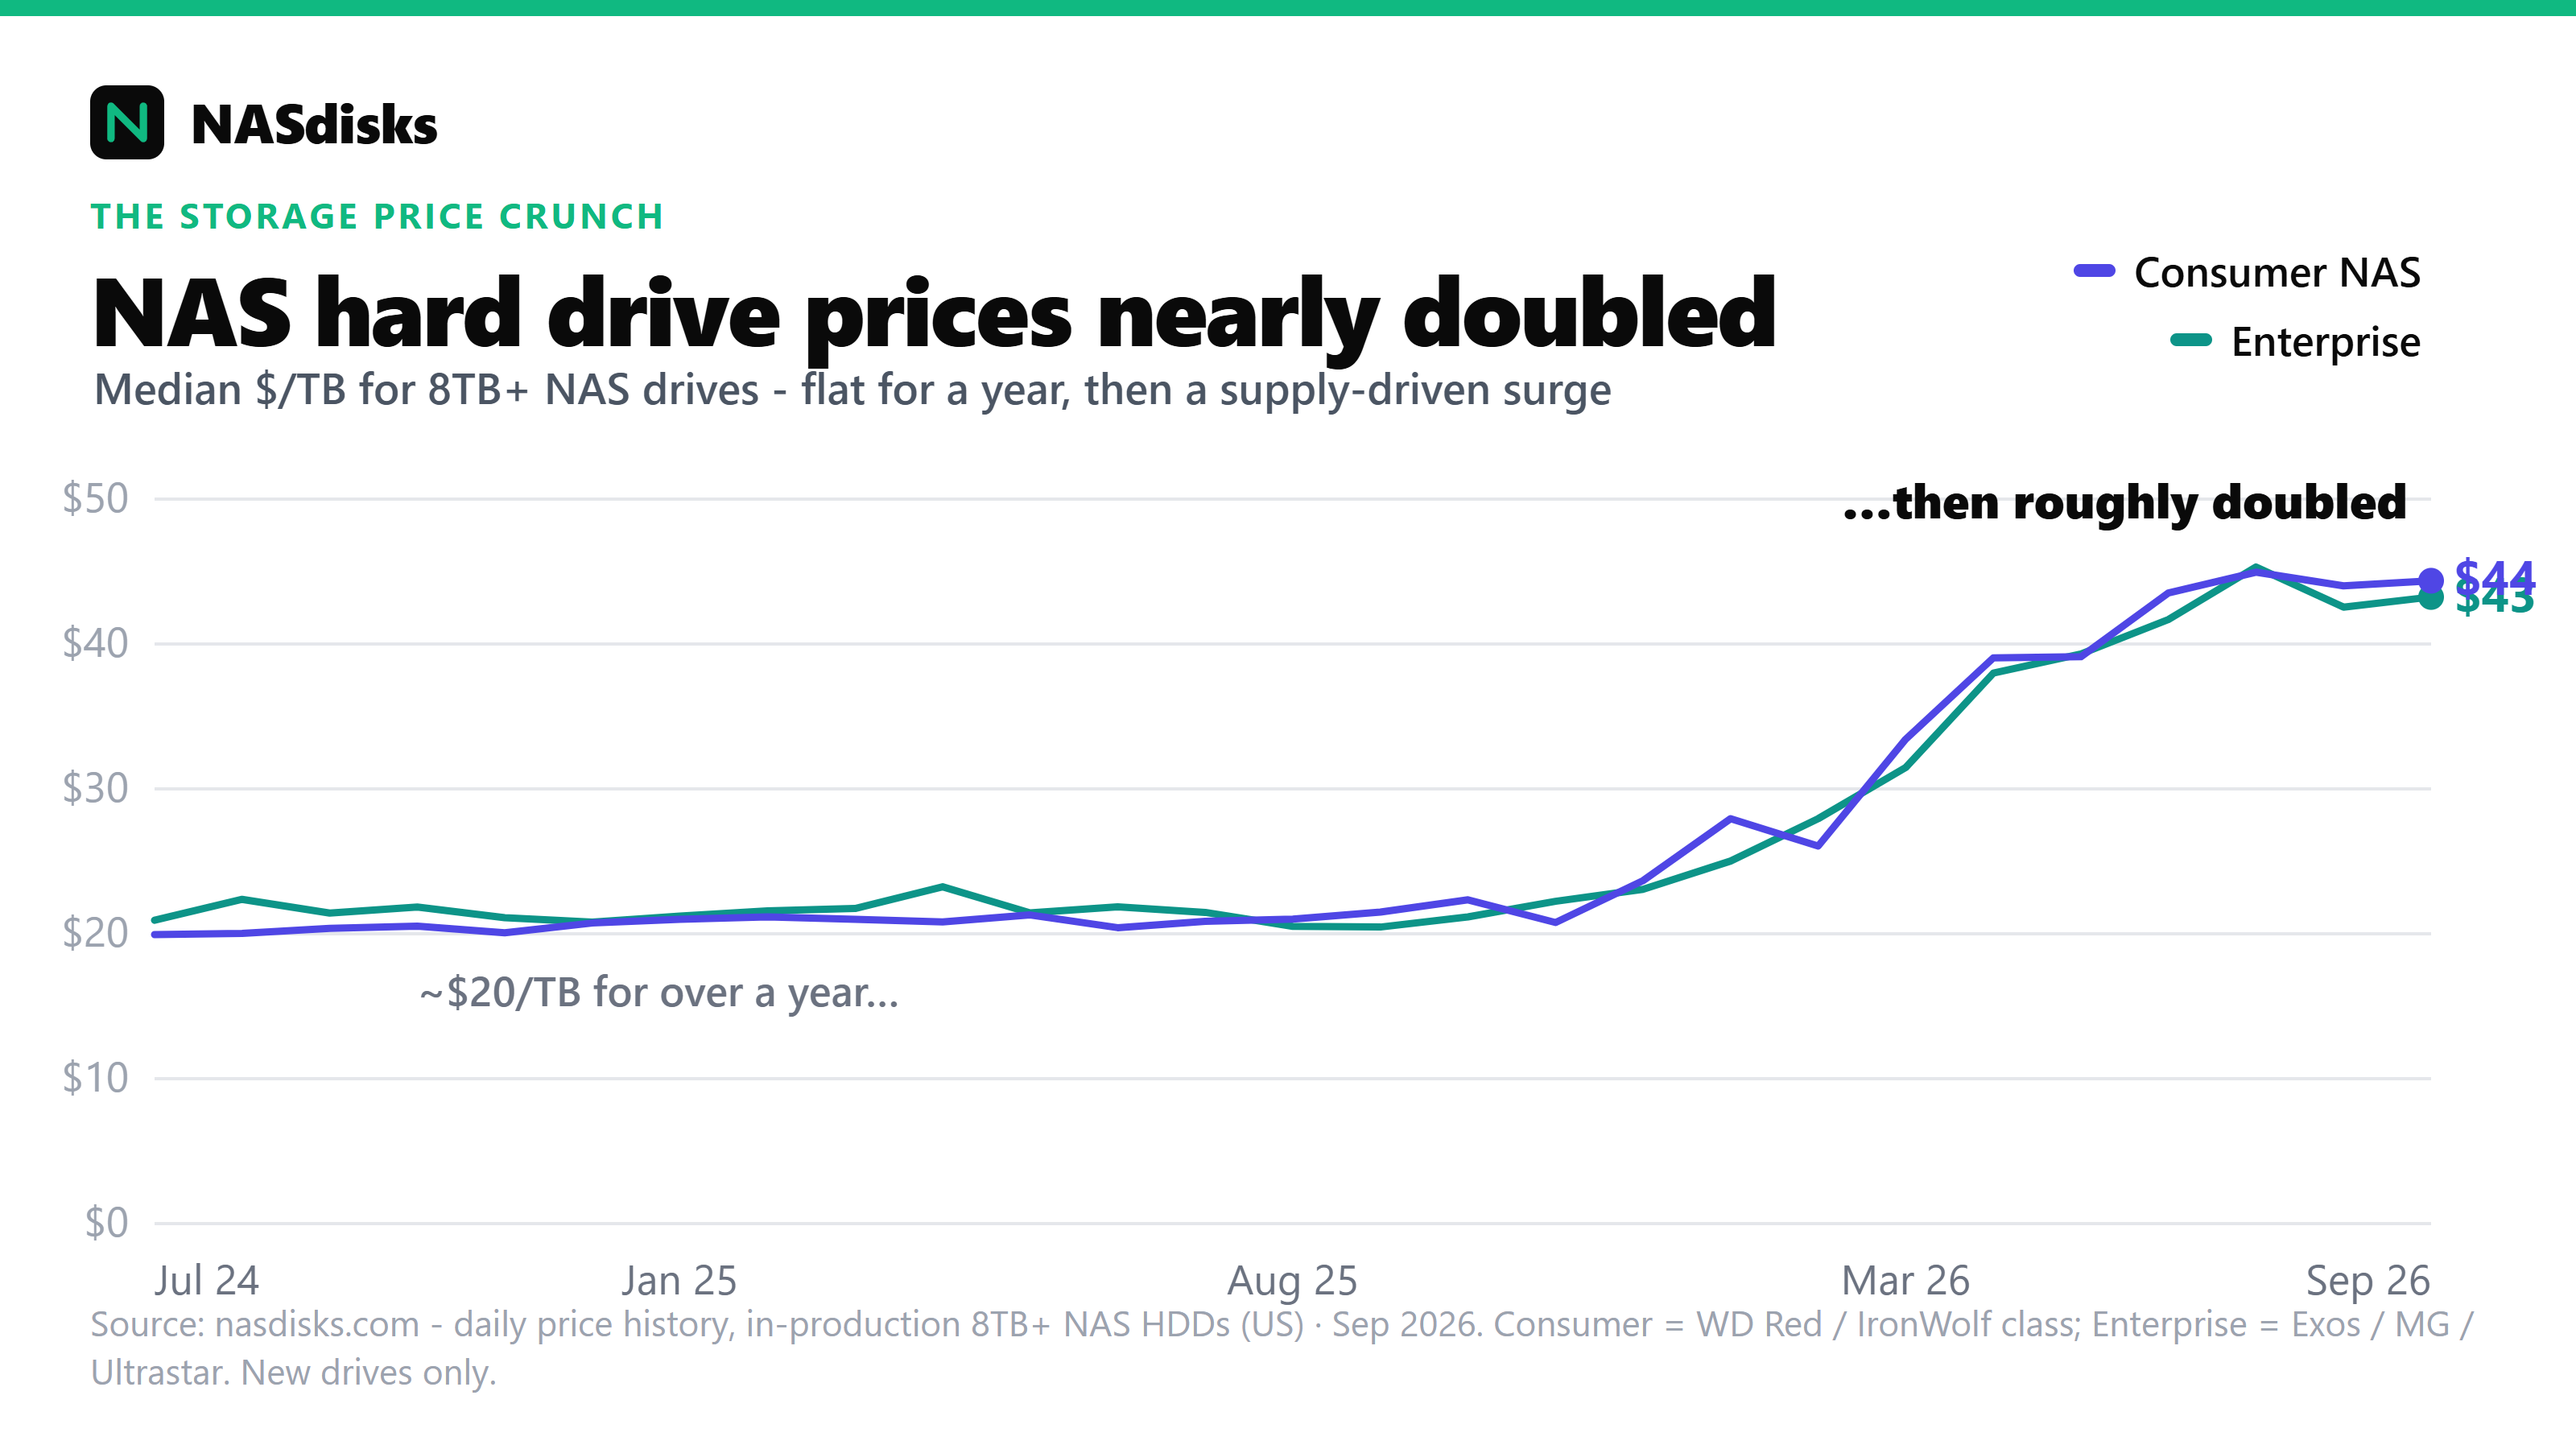
Monthly median price-per-terabyte for current 8TB+ NAS hard drives (US, new, in stock), from Jul 2024 to the latest month, split into the two tiers people choose between: consumer NAS (WD Red / IronWolf class) and enterprise (Exos / MG / Ultrastar).
The chart below tracks both tiers from Jul 2024 to the latest month. Prices held flat around $20 per terabyte for over a year, then climbed sharply from late 2025 to roughly double, and have stayed there since. Consumer NAS and enterprise drives moved almost in lockstep the whole way.
The trend
Median price-per-TB sat flat around $20/TB through 2024 and most of 2025, then roughly doubled to the mid-$40s/TB from late 2025, and has held there since. Both tiers moved together: among new drives, enterprise is not the price-per-TB bargain it's assumed to be, and both got hit about equally. The usual driver is the AI datacenter buildout pulling high-capacity nearline supply.
Sale frequency
A companion view, in sale-frequency-by-model.csv and sale-frequency-weekly.csv: how often each current drive actually goes on sale, and how deep. For each day we compare a drive's best price to a centred rolling median of its own recent price, so a genuine dip counts but the long price climb is not mistaken for a discount, then count the days sitting 5%+ below that baseline. Same scope as the $/TB series: 8TB and up, US, new in-stock prices, compiled from Amazon price history.
NAS drives (WD Red / IronWolf class, including the Pro lines) go on sale several times more often than enterprise/datacenter drives - roughly one day in ten vs one in forty - though the cut is about the same size when it happens (~10% typical, ~30% at the deepest). Seagate IronWolf Pro goes on sale most often; Exos and Ultrastar barely move. Interactive weekly chart + sortable table: nasdisks.com/articles/nas-drive-sale-frequency.
Files
monthly-median-per-tb.csv- columns:month,consumer_usd_per_tb,enterprise_usd_per_tb. Computed monthly medians only.sale-frequency-by-model.csv- per drive:brand,line,capacity_tb,segment(consumer= NAS lines incl. Pro,enterprise= datacenter),pct_days_on_sale,typical_discount_pct,deepest_discount_pct,sale_events,days_observed.sale-frequency-weekly.csv- weekly share of tracked days on sale per tier:week_start,consumer_pct_days_on_sale,enterprise_pct_days_on_sale.
Interactive version
- Hover, zoom, and a capacity-matched cheapest-per-TB table: nasdisks.com/articles/nas-drive-price-crunch.
- Part of the open NAS drive dataset, maintained at nasdisks.com.
Method
For each month, take each drive's average price-per-TB across its logged days, then the median of those per-drive values across drives (so a model with more logged days doesn't skew the month). Scope: 8TB and up, US, new in-stock prices, compiled from Amazon price history. CMR/SMR and specs from datasheets.
8TB and up because small drives carry a much higher price-per-TB (fixed per-drive costs spread over less capacity), and which small SKUs happen to be in stock would swing an all-capacity median for reasons unrelated to prices actually moving.
This folder publishes computed statistics only (monthly medians and the sale-frequency aggregates), not the underlying per-drive price observations.
Takeaway for buyers
Because the two tiers track each other, there's no reliable price-per-TB win from picking enterprise over consumer among new drives. Buy on price-per-TB and CMR vs SMR, not on tier. The one genuine discount is the recertified/refurbished enterprise market, which sits well below new prices but comes with shorter reseller warranties and prior drive hours, so it isn't included here. And since these are supply-driven prices, they are unlikely to snap back to 2024 levels soon; plan around the current floor rather than waiting for a rollback.
Using this data
The monthly medians and sale-frequency figures here are free to use, with a credit to nasdisks.com (a link back is appreciated). They are computed aggregate statistics, provided as-is, and separate from the repository's CC BY 4.0 license, which covers the drive specs and CMR/SMR data.